Surface plot options
This dialog box is used to customize a 3D function plot which has been created by the New -> New Surface 3D Plot command from the File menu. It is activated by a double click on the 3D plot.
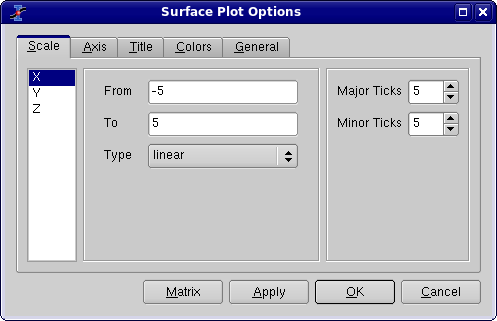
The first tab is used to modify the X, Y and Z ranges. It allows also to specify the number of labels on the axis and the number of secondary ticks.
The second tab defines the main parameters of the three axis: the axis label and its font, and the length of the ticks. This length is defined in the same units as the range of the axis. If something is changed in the scales of the graph, the length of the ticks is re-calculated by SciDAVis. The font button allows to modify only the font used for the label, if you want to customize the font of the numbers used for the axis, you must used the fifth tab.

The third tab is used to define or modify the title of the plot. You can not add subscripts/superscripts, bold characters, etc in your title as you can do it for 2D plots.

The fourth tab allows to modify the colors used in the different elements of the plot.

The first set of two colors (data min and data max) defines the color scheme which is used to show the Z-values. They are the colors used for the minimum value of Z (Zmin) and the maximum value of Z (Zmax). We can define the colors by their Red, Green and Blue parameters: [R,G,B]. Then, a value Z will be represented by a color defined as a linear interpolation:

The default colors for Zmin and Zmax are respectively blue ( [R,G,B] = [0,0,255] ) and red ( [R,G,B] = [255,0,0] ). This lead to the following color scheme:

Another classical color scheme can be built with Zmin = [160,32,32] and Zmax = [255,255,0] (yellow). It leads to:

Another way to define colors is to read a colormap from a file. The format of the file is simple: each line defines a color by red, green and blue values as integers between 0 and 255. The numbers should be separated by spaces. You can find several examples of colormaps on the QwtPlot3D web site.
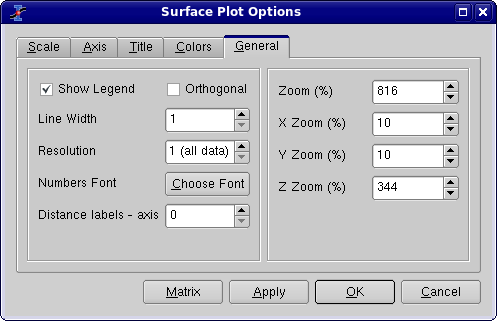
The last tab is used to define some global parameters and the aspect ratio of the plot. The default behaviour is to use the perspective to compute the 3D plot. If you choose to check the Orthogonal check box, the plot will use vertical Z axis whatever the view angle of the plot.