Add Function
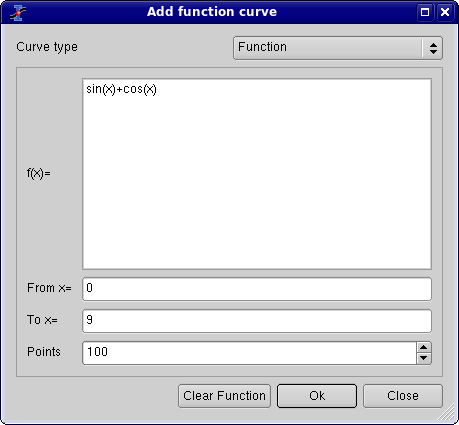
This dialog box is used to add a function curve to the active plot. The function can be built with the common operators: * + / - and ^ for the power. The intrinsic functions available are listed in the appendix.
The most common way to define a function is the classical cartesian coordinate definition y=f(x), this is the defaut option. The two following parameters allow to select the x range used for the plot, and the last one is used for the number of data points that are computed in the X-range.
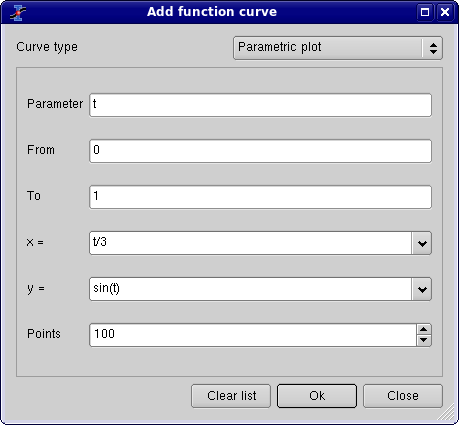
The functions can also be defined in a parametric definition: if t is the parameter, the (x,y) data points are computed by x=f(t) and y=g(t).
The first parameter is the name of the parametric variable (here t) followed by the range, the definition of the two functions and the number of data points.
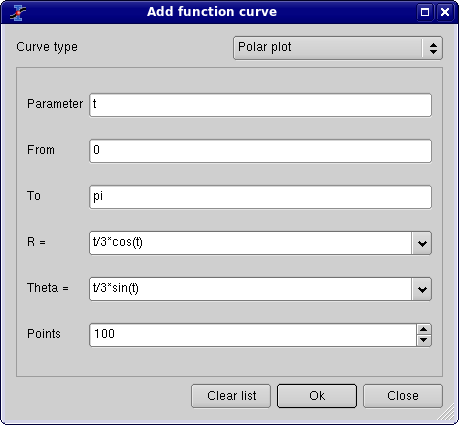
The last way is the polar definition of the function: if t is the parameter, the radius r and the angle theta are computed by r=f(t) and theta=g(t). Then the (x,y) data points are computed by x=r*cos(theta) and y=r*sin(theta).
The first parameter is the name of the parametric variable (here t) followed by the range, the definition of the two functions and the number of data points.The angle is defined in radians, and the constant value pi can be used: it is possible to use 3*pi to define the parameter range.


