Chapter 5. The Dialogs
- Table of Contents
- Add Error bars
- Add Function
- Add Layer
- Add/Remove curves.
- Add Text
- Arrange Layers
- Add Arrow
- Column Options
- Contour Curves Options
- Custom Curves
- Define surface plot
- Export ASCII
- Fast Fourier Transform
- Integrate dialog
- Non linear curve fit
- General Plot Options
- Plot Wizard
- Project Explorer
- Preferences Dialog
- Printer-setup
- Set Column Values
- Set Dimensions...
- Set options for Importation of ASCII files.
- Set Properties...
- Set Values...
- Surface plot options
- Text options
Add Error bars
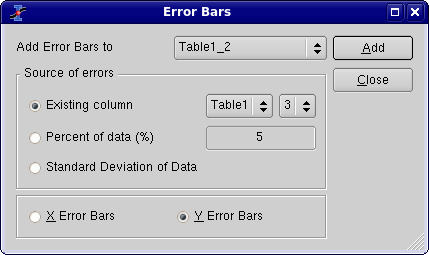
This dialog is activated by selecting the Add Error Bars... command from the Graph menu.
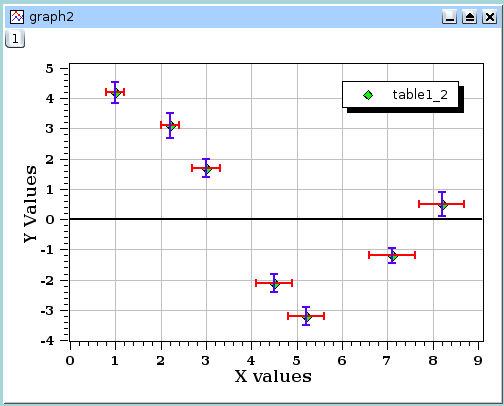
This command is used to plot X and/or Y error bars around the data points.
It must be taken care that the "add" button add the errors bars, and so do the "OK" button. Then, you should close the dialog with cancel if you have clicked on the "add" button.
There are three ways to specify the size of the bar:
- A column of the table
In this case, the values of the selected column are used to compute the error bars. if V is the value of the data point, and E the value of the errorbar column, the size of the bars will be V-E to V+E.
- A percentage of the values
if E is the percentage selected, the size of the bars will be V(1-E/100) to V(1+E/100). It must be noticed that, in addition to the errorbars on the plot, this command will create a new column in the active table with can be used in the way as with the previous option. This column can be modified like any other one.
- The standard deviation of the values
the standard deviation of the values. This has a meaning only of the data are centered around an average value. Like with the previous option, a new column will be created in the active table.

