3D plots
3D plot are generated from data defined as Z=f(X,Y). As for 2D plots, there are two ways to obtain a 3D plot depending on the way the (X,Y,Z) values are defined:
You can have your Z values in a matrix. SciDAVis will consider that all the data present in the matrix are Z values, and the X and Y values can be defined as a function of the columns and rows numbers.
The data in the matrix can be entered in several ways:
one by one from the keyboard,
by reading an ascii file in a table and converting the table into a matrix,
by setting the values with a function.
If you want to plot a function, you don't need a matrix. You can use directly the New -> New Surface 3D Plot command. This will open the corresponding dialog box and you will be able to define the mathematical expression of your function.
There are several kinds of 3D plots which can be selected, see the Plot3d menu section of the reference chapter for a list of the availables plots.
The 3D plots use OpenGL so you can easily rotate, scale and shift them with the mouse. Via the 3D plot settings dialog or via the Surface 3D Toolbar you can change all the predefined settings of a three dimensional plot: grids, scales, axes, title, legend and colors for the different elements.
There are several types of plots which can be built from a matrix. They are presented in the Plot3d menu
Direct 3D plot from a function
This is the simplest way to obtain a 3d plot. It is done with the New -> New Surface 3D Plot command from the File menu or directly with the Ctrl-Alt-Z. This will open the folowing dialog box:

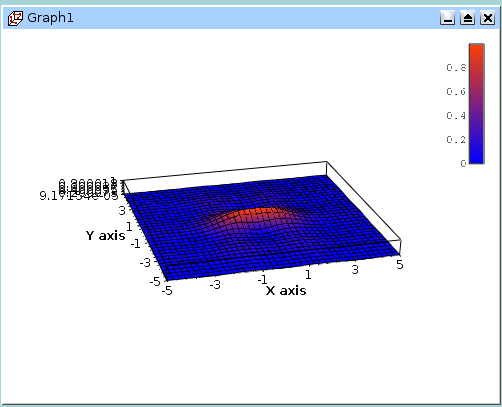
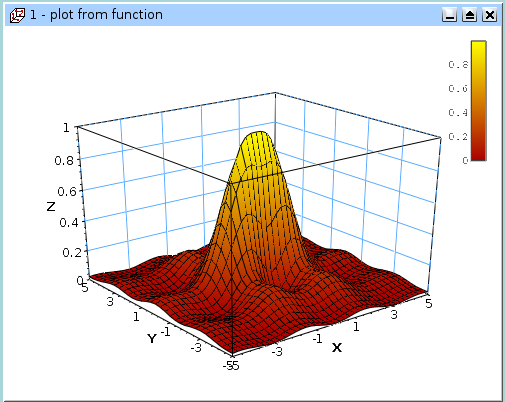
You can enter the function z=f(x,y) and the ranges for X, Y and Z. Then SciDAVis will create a default 3d plot:
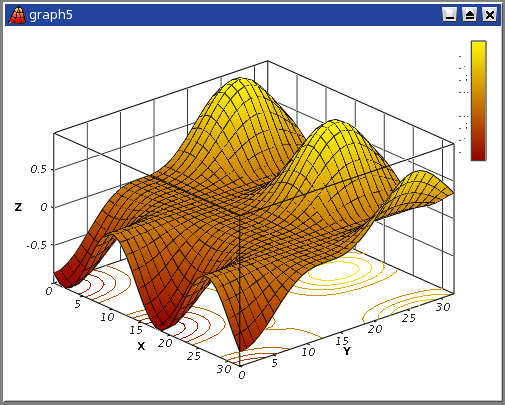
You can then customize this plot by opening the Surface plot options dialog. You can modify the axis ranges and parameters, add a title, change the colors of the different items, and modify the aspect ratio of the plot. In addition, you can use the different commands of the 3d plot toolbar to add grids on the walls or to modify the style of the plot. After some modifications, you can obtain the following plot:
If you want to modify the function itself, you can use the surface... command which can be activated from the context menu with a right click on the 3D plot. This will re-open the define surface function dialog box.
3D plot from a matrix
The second way to obtain a 3D plot is to use a matrix. Therefore, the first step is to fill the matrix.This can be done by defining a function.
The New -> New Matrix command create a default empty matrix with 32x32 cells. Then use the Set Dimensions... command to modify the number of rows and columns of the matrix. This dialog box is also used to define the X and Y ranges.

Then use the Set Values... command to fill the cells with numbers. The ranges of X and Y defined in the previous step are not known by this dialog box, then the function is defined with the row and column numbers (i and j) as entry parameters (see the section set-values for details).
The other way to obtain a matrix is to import an ASCII file into a table with the Import ASCII -> Single File... command from the File menu. The table can then be transformed in a matrix with the command Convert to Matrix command from the Table menu.
You can then use this matrix to build a 3D plot with one of the command of the Plot menu.