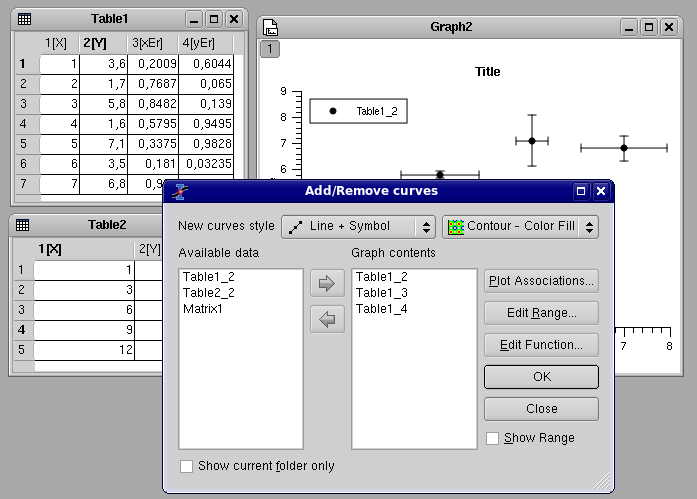
Add/Remove curves.
This dialog is activated by selecting the command Add/Remove Curves... from the Graph Menu.
The left window shows the columns which are available for plotting in the different tables of the project, and the right window gives the list of the curves already plotted. In the case presented below, there are two tables in which the Add/Remove Curves... dialog box allows to select columns. If you use this dialog box to add a column, the X column will be the one define as X in the corresponding table.
In this dialog box, if you select one curve of the plot in the right window, you can change the columns used for X and Y with the Plot Association button. In any case, you can't mix the X values of one table with the Y values of another one. If you wan't to do this, you have to copy the columns in the same table.
If the curve selected is a function, you can modify it. Refer to the Add Function... dialog box for more details on functions editing.
