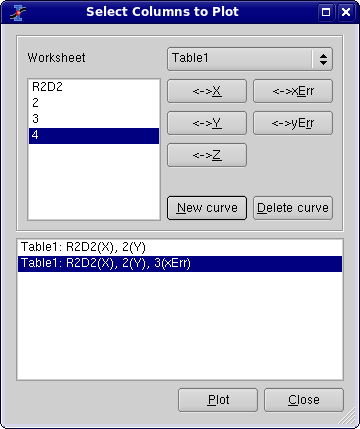
Plot Wizard
This dialog is activated by selecting the command Plot Wizard from the View Menu or with the Ctrl-Alt-W key. This command is always active.
This dialog is used to build a new plot by selecting the columns in the tables available in the current project. At first, you have to select the table you want to use, and then click on New curve to create the curve. After that, you have to select at least one column for X and one for Y. You can also select one more column for X-errors or for Y-errors. The plot created will have the default style you defined using the Preferences dialog through the '2D Plots -> Curves' tab.
